
Academic
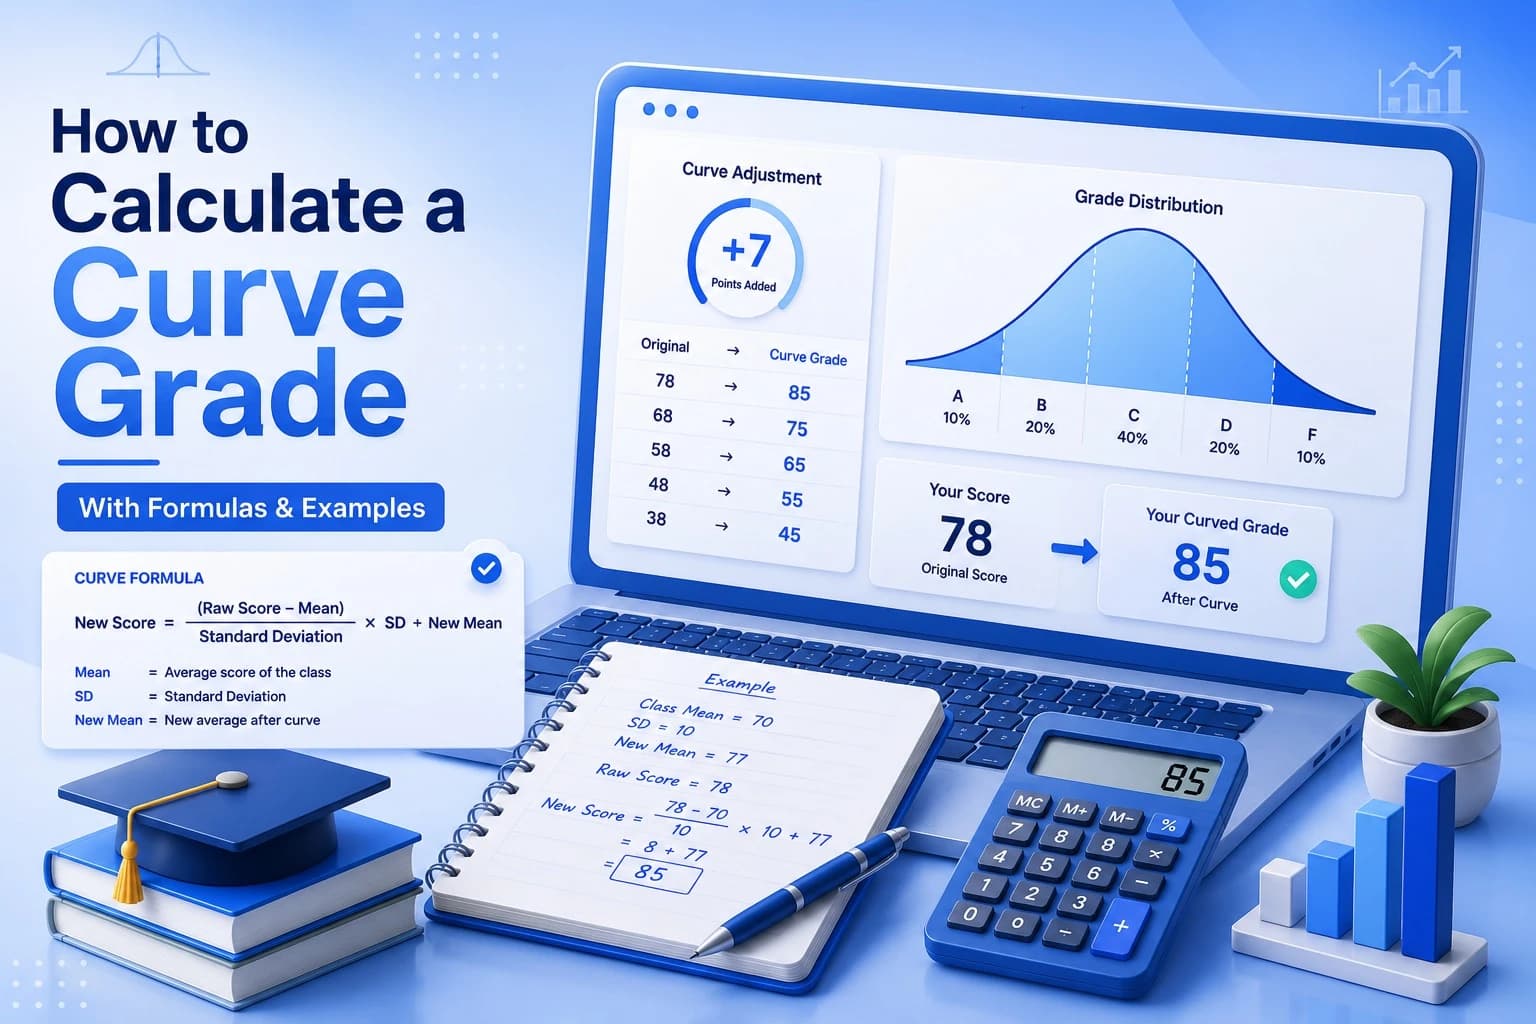
How to Calculate a Curve Grade
Learn how to calculate a curve grade using flat, percentage, square-root, bell-curve and linear methods with worked examples.
If your professor just announced that "the exam will be curved," you probably have two questions: how much will your grade actually change, and how is the new number even calculated? The honest answer is that "curving" isn't one single formula — it's a family of methods, and which one your instructor uses can change your final grade by a lot.
This guide walks through every common curving method used in real classrooms, shows the math behind each one with worked numbers, and gives you a framework for figuring out which method applies to your situation. By the end, you'll be able to calculate your own curved grade by hand, and you'll understand why two students with the same raw score can end up with different curved grades depending on the method their instructor picked.
Quick Summary: A grade curve is a class-wide adjustment applied to raw scores, usually because a test was harder, more ambiguous, or less well-calibrated than intended. It's calculated using one of several distinct formulas — not a single universal method — and the most common approaches in real classrooms are the flat (additive) curve and the percentage (multiplicative) curve. Further down, you'll find worked examples for all six methods, plus a calculator that does the arithmetic for you.
Table of Contents
- Quick Facts
- What "Curving a Grade" Actually Means
- Why Instructors Curve in the First Place
- When Grades Are NOT Curved
- The Six Curving Methods You'll Actually Encounter
- One Raw Score, Six Different Curves
- Comparison Table: Which Curve Method Does What
- How to Identify Your Professor's Curve
- Step-by-Step: How to Calculate Your Own Curved Grade
- Common Mistakes Students Make
- Decision Tree: Which Method Is Your Instructor Probably Using?
- FAQ
- Key Takeaways
Quick Facts
- Curving a grade means adjusting raw scores upward (occasionally downward) to correct for a test that was harder, easier, or less well-calibrated than intended.
- There is no universal curving formula — instructors choose the method, and the method matters more than most students realize. The six methods below are the most common, but instructors are also free to build custom adjustments suited to a specific exam.
- The two most common approaches in college and high school classes are the flat curve (add fixed points) and the percentage curve (scale everyone relative to the top score).
- Statistics-heavy courses sometimes use a standard deviation (bell) curve, which can lower some grades even while raising the average.
- Not every grade is curved. Standardized tests like the AP exams and SAT use statistical equating, not a classroom curve — see the section below.
- You can check your curved grade instantly using a grade curve calculator once you know which method your instructor used.
What "Curving a Grade" Actually Means
A curve is a deliberate adjustment applied to a whole class's scores, not to one individual's score. Instructors curve grades when the results suggest the test itself — not just student performance — was the problem. Maybe the average score was 58%, the questions were ambiguous, or a topic wasn't covered clearly enough in lecture. Curving is the instructor's way of separating "this test was flawed" from "these students didn't learn the material."
It's worth being precise about what curving is *not*. It isn't rounding your 89.4% up to a 90%. It isn't extra credit. It isn't a guarantee that everyone passes. It's a mathematical transformation applied consistently to every score in the dataset, and depending on the method, it can help almost everyone, help only the lower scorers, or barely move the needle at all.
A peer-reviewed guide on grade adjustment for health sciences programs makes a similar distinction, separating adjustments made to individual flawed exam questions from adjustments made to an entire assessment's score distribution — the two are calculated differently and shouldn't be confused.
Why Instructors Curve in the First Place
Understanding the motivation helps you predict which method you're likely to see:
- The test was too difficult. If the class average is far below what the instructor expected (say, a 62% average on a test designed to average 80%), a curve corrects for miscalibrated difficulty.
- A question was flawed or ambiguous. Sometimes only one or two questions get curved — everyone gets credit, or partial credit is expanded — rather than curving the whole test. Carnegie Mellon's Eberly Center specifically recommends that instructors have a clear rationale for this, such as a question that was inadvertently phrased in a confusing way.
- Grading needs to fit an institutional distribution. Some departments require grades to roughly follow a bell-shaped distribution across a large lecture section, which is where standard deviation curves come from.
- Comparing across sections or semesters. Large courses with multiple sections and instructors sometimes curve to make grades comparable, since not every section takes an identically difficult exam.
None of these reasons obligate an instructor to curve — curving is discretionary, and syllabi often say curving "may" happen rather than "will" happen. That's why you should never assume a curve is coming. In fact, some teaching centers actively discourage curving as a default practice. Carnegie Mellon's Eberly Center, for example, states that it does not recommend grading on a curve, and instead advises instructors to set clear, measurable standards for each assignment and apply them consistently throughout the course. Cornell's Center for Teaching Innovation similarly frames grading policy around clear, pre-communicated standards and rubrics rather than after-the-fact adjustment.
When Grades Are NOT Curved
It's easy to assume curving is universal, but a large share of the assessments students take are never curved at all:
- AP Exams. The College Board has stated directly that AP students are not graded on a curve — instead, raw composite scores go through a statistical process called *equating*, which converts them to the familiar 1–5 scale so that a given score reflects the same level of mastery from year to year, regardless of how that year's exam compared in difficulty.
- SAT and ACT. These use similar equating methods rather than classroom-style curves, again to keep scores comparable across different test dates and versions.
- Many professional certification and licensing exams. Fields with pass/fail licensing thresholds (bar exams, medical boards, and similar certifications) typically use fixed competency standards rather than curving relative to other test-takers, because the goal is to certify a minimum standard of knowledge, not to rank candidates against each other.
- Courses with an explicit no-curve policy. Some instructors state upfront, often for the reasons Carnegie Mellon's Eberly Center outlines, that grades will not be curved under any circumstances, and that the syllabus grading scale is final.
If you're studying for a standardized test, curving math generally won't apply to you the way it applies to a classroom exam — what you're dealing with instead is a scaled or equated score, which is a related but distinct concept.
The Six Curving Methods You'll Actually Encounter
A quick note before diving in: these six methods cover the vast majority of what you'll see in real courses, but they are common examples, not an exhaustive legal or mathematical standard. Some instructors build a custom adjustment — for example, adding points only to specific questions, or blending two methods — so always confirm the actual formula with your instructor rather than assuming it matches exactly one of the six below.
1. The Flat (Additive) Curve
This is the simplest and most common method, especially in high school and introductory college courses.
Formula:
`New Score = Old Score + X points`
X is usually calculated as `100 − highest raw score`, meaning the top scorer gets bumped to 100 and everyone else gets the same number of points added.
Worked example:
Suppose the highest score on the exam was 88%. The curve adds `100 − 88 = 12` points to every score in the class.
| Raw Score | Curved Score |
|---|---|
| 88% | 100% |
| 75% | 87% |
| 61% | 73% |
| 50% | 62% |
Key Takeaway — Flat Curve
- Best for: Simple exams where the instructor wants a transparent, easy-to-explain adjustment.
- Biggest advantage: Easy to calculate and verify by hand.
- Biggest disadvantage: Everyone gains the same number of points regardless of how far below the top they scored, which can feel disproportionate to high scorers.
Want to calculate this automatically? Plug your raw score and the class's highest score into our Grade Curve Calculator.
2. The Percentage (Multiplicative) Curve
Instead of adding fixed points, this method scales every score proportionally so the highest score becomes 100%.
Formula:
`New Score = Old Score × (100 / Highest Score)`
Worked example:
If the highest score was 80%, the scaling factor is `100 / 80 = 1.25`.
| Raw Score | Calculation | Curved Score |
|---|---|---|
| 80% | 80 × 1.25 | 100% |
| 64% | 64 × 1.25 | 80% |
| 48% | 48 × 1.25 | 60% |
| 32% | 32 × 1.25 | 40% |
Key Takeaway — Percentage Curve
- Best for: Instructors who want the boost to scale with performance instead of being a flat bonus.
- Biggest advantage: Rewards higher scorers with a larger raw-point gain, which many instructors see as proportionally fairer.
- Biggest disadvantage: Students near the bottom of the distribution get a smaller absolute benefit.
Want to calculate this automatically? Use our Grade Curve Calculator to scale your score to the class high instantly.
3. The Square Root Curve
This method is popular in math, science, and engineering courses because it disproportionately helps students in the middle and lower range of scores while barely touching top scorers.
Formula:
`New Score = √(Old Score) × 10`
This only works cleanly when scores are out of 100.
Worked example:
| Raw Score | Calculation | Curved Score |
|---|---|---|
| 100% | √100 × 10 | 100% |
| 81% | √81 × 10 | 90% |
| 64% | √64 × 10 | 80% |
| 49% | √49 × 10 | 70% |
| 25% | √25 × 10 | 50% |
Notice the pattern: a 49% jumps to a 70% (a 21-point gain), while a 100% stays at 100% (no gain at all). This is the defining feature of the square root curve — it compresses the gap between high and low performers.
Key Takeaway — Square Root Curve
- Best for: STEM courses with historically difficult exams where the instructor wants to lift the middle of the pack without inflating already-strong scores.
- Biggest advantage: Gives the largest boost to students who need it most.
- Biggest disadvantage: Top scorers can feel their performance wasn't rewarded, since the gain shrinks as the raw score rises.
Want to calculate this automatically? Our Grade Curve Calculator can run the square-root method for you.
4. Highest-Score-to-100 Normalization
Sometimes described separately from the percentage curve, this method simply treats the top score in the class as the new maximum (100%) and doesn't necessarily scale everyone proportionally — instead it can shift the whole grading scale rather than each individual score. In practice, most instructors implement this exactly like the percentage curve above, so the math is usually identical. The distinction matters mainly in how the instructor talks about it in class ("the highest score becomes the new 100%") versus how they calculate it (multiplicative scaling).
Key Takeaway — Normalization
- Best for: Classes where the instructor wants a simple mental model ("top score = 100%") without necessarily explaining the underlying multiplication.
- Biggest advantage: Intuitive to describe to students.
- Biggest disadvantage: Ambiguous unless the instructor clarifies the exact formula, since it's often just the percentage curve by another name.
5. The Standard Deviation (Bell) Curve
This is the most statistically involved method and the one most likely to be misunderstood. Rather than adjusting individual scores directly, the instructor assigns letter grades based on how far each score sits from the class mean, measured in standard deviations.
How it works, step by step:
- Calculate the class mean (average score).
- Calculate the standard deviation of all scores.
- Assign letter grades based on which "band" each score falls into, typically:
- Mean + 1.5 SD or higher → A
- Mean + 0.5 SD to 1.5 SD → B
- Mean − 0.5 SD to + 0.5 SD → C
- Mean − 1.5 SD to − 0.5 SD → D
- Below Mean − 1.5 SD → F
Worked example:
If the class mean is 70 and the standard deviation is 10, the bands become:
- A: 85 and above
- B: 75–84
- C: 65–74
- D: 55–64
- F: below 55
A student who scored 72% lands in the C band under this system, even though 72% might look like a C+ or B- on a traditional fixed scale. This is the key thing students misunderstand about bell curves: your raw score doesn't map to a grade in isolation — it only matters relative to the rest of the class.
Key Takeaway — Bell Curve
- Best for: Large lecture courses or departments with a stated grade-distribution policy.
- Biggest advantage: Keeps grade distributions consistent across different exam versions, sections, or years.
- Biggest disadvantage: Can lower an individual's grade relative to a fixed percentage scale, and is less statistically meaningful in small classes.
Want to see where your score lands relative to the class average? Our Grade Curve Calculator can help you sanity-check the math.
6. The Linear Transformation Curve
Less common outside of statistics-literate instructors, this method stretches the entire score range between a chosen minimum and maximum.
Formula:
`New Score = ((Old Score − Lowest Score) / (Highest Score − Lowest Score)) × (New Max − New Min) + New Min`
Worked example:
Suppose the lowest score was 40%, the highest was 90%, and the instructor wants the new range to run from 60% (new min) to 100% (new max).
For a raw score of 70%:
`((70 − 40) / (90 − 40)) × (100 − 60) + 60 = (30/50) × 40 + 60 = 24 + 60 = 84%`
Key Takeaway — Linear Transformation
- Best for: Instructors who want full control over both the floor and ceiling of curved grades.
- Biggest advantage: Most flexible and precise of the six methods.
- Biggest disadvantage: Hardest for students to reverse-engineer without knowing the instructor's chosen min/max.
One Raw Score, Six Different Curves
To see just how much the method matters, here's what happens to a single raw score of 68% under each of the six methods, assuming a class high of 92%, a class low of 38%, a class mean of 70, and a class standard deviation of 9.
| Method | Resulting Score | Notes |
|---|---|---|
| Flat (Additive) | 76% | Adds 8 points (100 − 92) to every score |
| Percentage (Multiplicative) | 73.9% | Scales by 100/92 ≈ 1.087 |
| Square Root | 82.5% | √68 × 10 ≈ 82.46 |
| Highest-to-100 Normalization | 73.9% | Same as percentage curve in this example |
| Standard Deviation (Bell) | Falls in the "C" band | 68 is within 0.5 SD below the mean (70 − 9×0.5 = 65.5), just above the D cutoff |
| Linear Transformation (new range 60–100) | 75.6% | ((68−38)/(92−38)) × 40 + 60 |
A single 68% ranges anywhere from a C-band grade to a 82.5% depending purely on which formula the instructor picked — which is exactly why confirming the method matters more than memorizing any one formula.
Comparison Table: Which Curve Method Does What
| Method | Helps Most | Helps Least | Complexity | Common In |
|---|---|---|---|---|
| Flat (Additive) | Everyone equally (same points) | N/A — uniform benefit | Low | High school, intro courses |
| Percentage (Multiplicative) | Higher scorers | Lower scorers | Low | General college courses |
| Square Root | Mid-to-low scorers | Top scorers (minimal gain) | Medium | STEM, math-heavy courses |
| Highest-to-100 | Top scorer becomes 100% baseline | Depends on implementation | Low | General courses |
| Standard Deviation (Bell) | Students far below the mean, relative to peers | Students near the mean in a strong class | High | Large lectures, standardized grading |
| Linear Transformation | Depends on chosen min/max | Depends on chosen min/max | Medium-High | Statistics-aware instructors |
How to Identify Your Professor's Curve
Instructors rarely say "I'm using a multiplicative percentage curve." They describe it in plain language, and the phrasing is usually a reliable clue:
| What Your Instructor Says | Likely Method |
|---|---|
| "I'm adding 5 points to everyone" | Flat (Additive) Curve |
| "I'm scaling everyone to the highest score" | Percentage Curve or Normalization |
| "The top score is now the new 100%" | Percentage Curve or Normalization |
| "I'm taking the square root of your score" | Square Root Curve |
| "Grades are based on the class average and standard deviation" | Bell Curve |
| "I'm stretching the range so the lowest passing score is a 60" | Linear Transformation |
| "Only question 4 is being curved" | Custom, per-question adjustment |
If your instructor's description doesn't clearly match one of these, ask directly — it's a completely reasonable question, and it's the only way to be sure your own calculation is correct.
Step-by-Step: How to Calculate Your Own Curved Grade
- Find out which method your instructor used. Check the syllabus, the exam return sheet, or ask directly. Never assume — the difference between methods can be 10+ percentage points.
- Identify the key numbers. For a flat or percentage curve, you need the highest score in the class. For a bell curve, you need the class mean and standard deviation (your instructor usually shares these, or you can ask).
- Apply the matching formula from the sections above.
- Double-check with a second method. If your instructor announced "I curved everyone up by 8 points," that's a flat curve — don't accidentally apply a percentage formula.
- Verify against a known data point. If you know the top scorer's curved grade (often 100%), confirm the formula reproduces that number before trusting it for your own score.
Worked calculator example:
- Raw Score: 72%
- Highest Score in Class: 90%
- Selected Method: Percentage Curve
- Calculation: 72 × (100 / 90) = 80%
- Final Result: 80%
If you'd rather skip the manual math, you can plug your raw score and the class's highest score into a grade curve calculator and get the flat or percentage curve instantly — useful for double-checking your instructor's numbers or estimating your grade before scores are officially posted. It pairs well with our broader Grade Calculator and Weighted Grade Calculator if you also need to see how a curved exam affects your overall course grade.
Common Mistakes Students Make When Calculating Curves
⚠️ Watch out: These are the errors that most often lead students to miscalculate their own curved grade.
- Assuming every curve is additive. Many students default to "just add points" even when the instructor used a percentage or square root method, which produces a different — sometimes smaller — result.
- Using the wrong "highest score." If extra credit questions are involved, the highest score used in the formula might exceed 100%, which changes every other calculation.
- Confusing a bell curve with grade inflation. A bell curve can lower your grade relative to a raw percentage scale, especially if the whole class did well. It's not automatically a benefit.
- Applying a curve to already-weighted grades. If your "score" is already a weighted combination of categories (homework, quizzes, exams), curving that number directly is mathematically different from curving the raw exam score and then re-weighting. Our Final Grade Calculator can help you see the difference once you know your curved exam score.
- Forgetting that curves are often per-assignment, not per-course. A curved midterm doesn't necessarily mean your final grade or other assignments are curved the same way.
- Assuming a curved score can't go below your raw score. Downward adjustments are uncommon but not impossible — see the FAQ below.
Decision Tree: Which Method Is Your Instructor Probably Using?
Use this quick logic if your instructor hasn't specified a method:
- Small class, casual announcement ("I'm adding some points") → almost certainly a flat curve.
- Instructor mentions "scaling to the highest score" → percentage curve.
- STEM course with historically low averages, instructor mentions "square root" → square root curve.
- Large lecture, instructor mentions "grade distribution" or "relative grading" → standard deviation (bell) curve.
- Instructor gives you a new minimum and maximum explicitly → linear transformation.
- Instructor mentions one specific question, not the whole exam → custom, per-question adjustment rather than any of the six whole-exam methods.
Expert Tip
When an instructor curves an exam, ask them directly which formula was used and whether the curve applies to that single assignment or to the whole grading scale. Most instructors are happy to explain — and having the exact method in writing (even just a syllabus screenshot or email) protects you if there's ever a dispute about your final grade.
Frequently Asked Questions
Can a curve lower my grade?
Yes, in two scenarios: a standard deviation curve applied to a class that performed unusually well can push your relative standing down even if your raw score didn't change, and rarely, an instructor may apply a "downward curve" if a test was too easy and grades need to be brought back in line with course objectives. Downward curves are uncommon but not against academic policy at most institutions.
Is curving the same as rounding?
No. Rounding adjusts a single score to the nearest whole number or grade boundary. Curving is a class-wide statistical adjustment based on how the whole group performed.
Do all professors curve grades?
No — curving is discretionary, and some teaching centers, including Carnegie Mellon's Eberly Center, explicitly advise against defaulting to it in favor of clear, consistent grading standards set in advance. Check your syllabus for a stated curving policy rather than assuming one exists.
Do all universities curve grades?
No. Curving policy varies by institution, department, and even individual instructor. Some departments require grade distributions to follow a set pattern (favoring bell curves), while others leave it entirely to the instructor's discretion, and many never curve at all.
Can professors curve only one exam?
Yes. Curving is typically applied assignment-by-assignment, not automatically across the whole course. An instructor might curve a difficult midterm but leave the final exam and homework grades untouched.
Can a curved grade exceed 100%?
It's possible, depending on the method and whether extra credit is involved. A flat curve added to an already-high score, or a percentage curve applied when the "highest score" used in the formula was itself above 100% due to extra credit, can push a curved grade past 100%. Whether that's capped at 100% is an instructor's policy decision, not a mathematical requirement.
Is grade curving fair?
This depends on the method and the reasoning behind it, and reasonable people disagree. Proponents argue curving corrects for test difficulty the instructor didn't anticipate; critics argue it can create unpredictable outcomes and tie your grade to your classmates' performance rather than your own mastery of the material. This is part of why some teaching centers, like Carnegie Mellon's Eberly Center, recommend clear rubrics over curving as the more predictable and transparent approach.
How can I tell which curve my instructor used?
Compare what they said in class or in an announcement against the phrasing table in the "How to Identify Your Professor's Curve" section above, or simply ask them directly which formula they applied.
What's the difference between a curve and extra credit?
Extra credit adds separate opportunities to earn points. A curve mathematically transforms the scores you already earned. They can be used together, but they solve different problems — extra credit rewards additional work, while curving corrects for test difficulty.
How do I know if my class uses a bell curve?
Ask whether grades are assigned "on a curve" relative to the class mean and standard deviation, or whether the department has a stated grade distribution policy (common in large intro STEM lectures at many universities). If your instructor mentions "the mean" and "standard deviation" when discussing grades, that's a strong signal.
Can I calculate my curved grade before the instructor posts it?
Yes, if you know the method and the relevant class statistics (highest score, or mean and standard deviation). Many instructors post the raw class average and high score along with individual results, which is enough to reverse-engineer a flat or percentage curve using a grade curve calculator.
Are AP, SAT, or ACT scores curved the same way as a classroom exam?
No. Standardized tests like the AP exams use a statistical process called equating rather than a classroom curve, converting raw scores to a scaled score so that results are comparable across different exam versions and years, regardless of that year's difficulty.
Key Takeaways
- Curving is a class-wide statistical adjustment, not a personal bonus, and there are several distinct methods — flat, percentage, square root, normalization, bell curve, and linear transformation — plus custom, instructor-designed variations.
- The method your instructor chooses changes the outcome significantly, so always confirm which one applies before calculating your own grade.
- Not all assessments are curved — standardized tests like AP exams, the SAT, and the ACT use statistical equating instead, and some instructors and teaching centers avoid curving altogether in favor of fixed, transparent standards.
- Bell curves can lower your relative grade even when your raw score stays the same, because they measure your standing against the rest of the class rather than against a fixed percentage scale.
- Square root curves help mid-range and lower scorers the most, while percentage curves reward higher scorers with a larger point gain.
- When in doubt, ask your instructor which formula they used, and verify your understanding by checking that the top score maps to the expected result.
Conclusion
Curving feels mysterious mostly because instructors rarely explain which method they're using — they just announce that grades "went up." Once you know the six methods above and can recognize which one applies from how your instructor describes it, the math is straightforward, even if the reasoning behind each method takes a bit more thought. If you want to skip the manual arithmetic entirely, our grade curve calculator handles the flat and percentage methods instantly, so you can check your grade the moment scores are posted — and once you have your curved exam score, our GPA Calculator can show you how it affects your overall average.
About the author
Educational Technology Writer & Full Stack Developer
Abubakar is an educational technology writer and full stack developer who specializes in building accurate academic calculators and creating easy-to-understand learning resources. His work focuses on simplifying complex grading systems, GPA calculations, academic percentages, and other educational concepts into practical tools that students, teachers, and professionals can use with confidence.